

Call Stats shows live connection details for your current call. Use it to check whether packet loss, delay, network routing, or another known condition might be affecting call quality.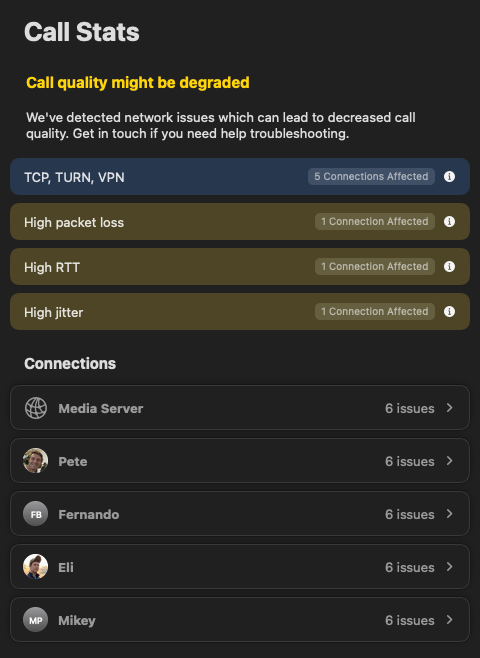
Open Call Stats
- Start or join a Tuple call.
- From the macOS menu bar, select Window > Call Stats.
Understand the summary
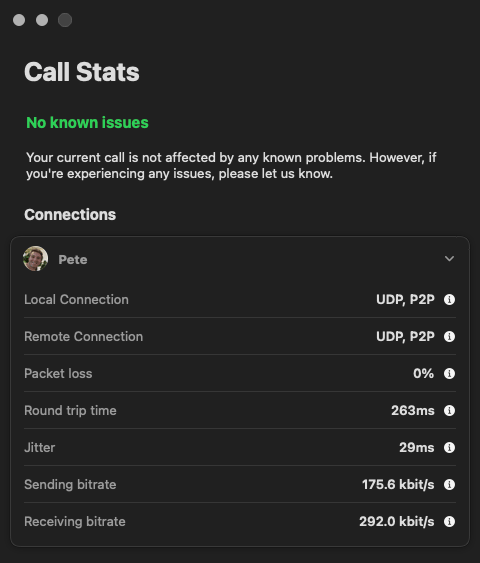
The top of the window summarizes Tuple’s current assessment:- No known issues means Tuple hasn’t detected a known connection problem.
- Call quality might be affected means the call is using a connection that can add latency, such as TCP, TURN, or a VPN.
- Call quality might be degraded means Tuple has detected high packet loss, round-trip time, or jitter.
Read connection details
Expand a participant to see live stats for your connection with them. On calls that use a media server, Call Stats also separates the stream you send to the media server from the streams you receive for each participant.Values and connection types highlighted in yellow or blue match the conditions in the summary. TCP, TURN, and VPN don’t always mean that a call will have problems, but they can help explain added latency.If Call Stats shows a problem, try the steps in Reducing latency. For TCP, TURN, or VPN connections, also review Networking and firewall issues.